Common Yellowthroat

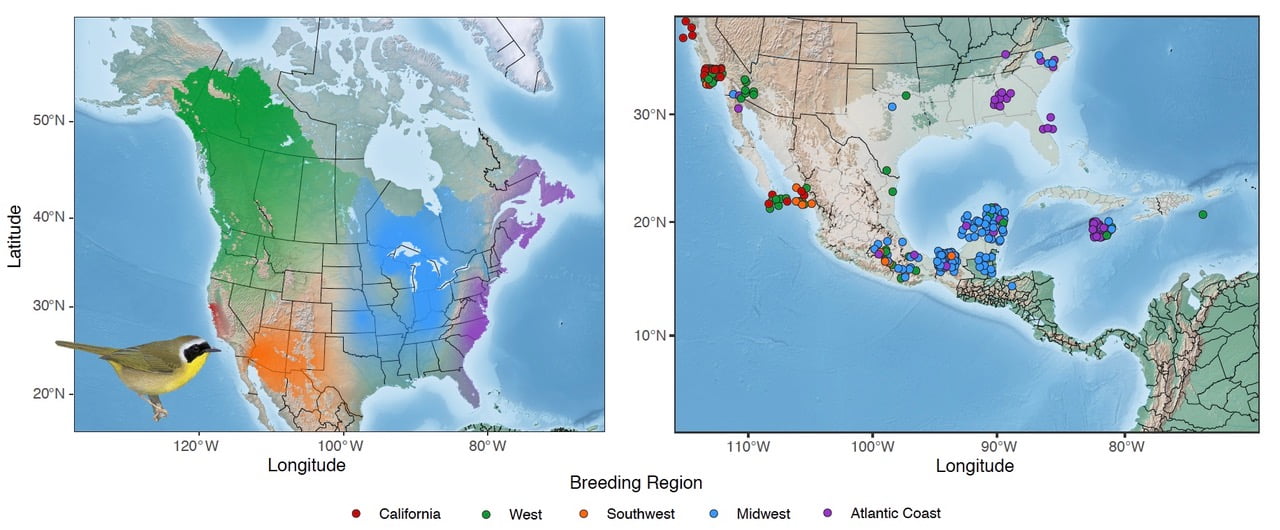
The five genetically distinct populations of Common Yellowthroat (Geothlypis trichas) (left map) across the breeding range: California (red), West (green), Southwest (orange), Midwest (blue), and Atlantic Coast (purple). Individuals sampled on the wintering grounds (right map) were then assigned back to a genetic cluster, allowing us to better understand the migratory connectivity of Common Yellowthroat populations. Genetic clusters are visualized as transparency levels of different colors overlaid overlaid upon a base map from Natural Earth (naturalearthdata.com) and clipped to the species breeding range using an eBird shapefile. See below for details of samples used. Common Yellowthroat Image by © Birds of the World
The Common Yellowthroat (Geothlypis trichas) is one of the most common and widely-distributed wood warblers in North America, breeding across much of Canada, the United States, and northern Mexico (Guzy and Ritchison 1999). Despite it’s widespread distribution, some populations, like those in California, are listed as Species of Special Concern (Shuford and Gardali 2008). Their numbers in California have decreased largely due to the alteration and destruction of the wetland habitats they rely on. These habitats have been lost to human development, including the installation of alternative energy sources like solar fields.
In addition to removing natural habitats, alternative energy source also pose a threat to migratory birds due to collisions with energy components that lead to mortalities. As California and other states scale up alternative energy development, it is imperative that we understand the impacts on migratory birds, and specific populations of concern. With the help of numerous collaborators (see below) we used our genomic methodologies to characterize the population genomic structure of the Common Yellowthroat across its entire breeding range, and how those genetic groups may be impacted by solar energy sites. After scanning the genomes of 27 Common Yellowthroat carcasses gathered at solar facilities across California, it was found that these individuals came from the large Western (green) population rather than the smallest and declining California-endemic population (red). This work provides the state of California and future energy developers with much needed tools for siting and monitoring renewable energy facilities and their impact on specific populations of migratory birds.
Bird Migration Explorer: Click here to see how Audubon’s Bird Migration Explorer has incorporated our Commonn Yellowthroat genoscape into their base map.
Publications:
Bobowski TJ, Bossu C, Rueda-Hernández R, Schweizer T, Tello-Lopez I, Smith TB, Feldman R, Cohen E, and Ruegg K. 2025. Factors underlying migratory timing of a seasonally migrating bird. Scientific Reports: 15, 8527.
Zamudio-Beltrán LE, Bossu CM, Bueno-Hernández AA, Dunn PO, Sly ND, Rayne C, Anderson EC, Hernández-Baños BE, and Ruegg KC. 2024. Parallel and convergent evolution in genes underlying seasonal migration. Evolution Letters.
Dunn PO, Sly ND, Freeman-Gallant CR, Henschen AE, Bossu CM, Ruegg KC, Minias P, and Whittingham LA. 2024. Sexually selected differences in warbler plumage are related to a putative inversion on the Z chromosome. Molecular Ecology: 33:e17525.
Ruegg KC, Bossu CM, Rajbhandary J, Fuller T, Harrigan R, and T Smith. 2020. A genoscape framework for assessing the population-level impacts of renewable energy development on migratory bird specices in California. California Energy Commission: CEC-500-2020-036
Team:
Jasmine Rajbhandary
Trevon Fuller, UCLA
A. Patterson
B. Kus
R. Taylor
B. Keith
B. Shepherd & M. Wesbrook
C. Millard
H. Chambers
J. & D. Downy
J. Port
K. Slankard
K. Allen
M. Fylling
T. Kita
MAPs station operators within the Institute of Bird Populations Network
Utilized Common Yellowthroat Samples
Explore the map below to see when, where, and who collected the samples to build the genoscape.
