American Redstart

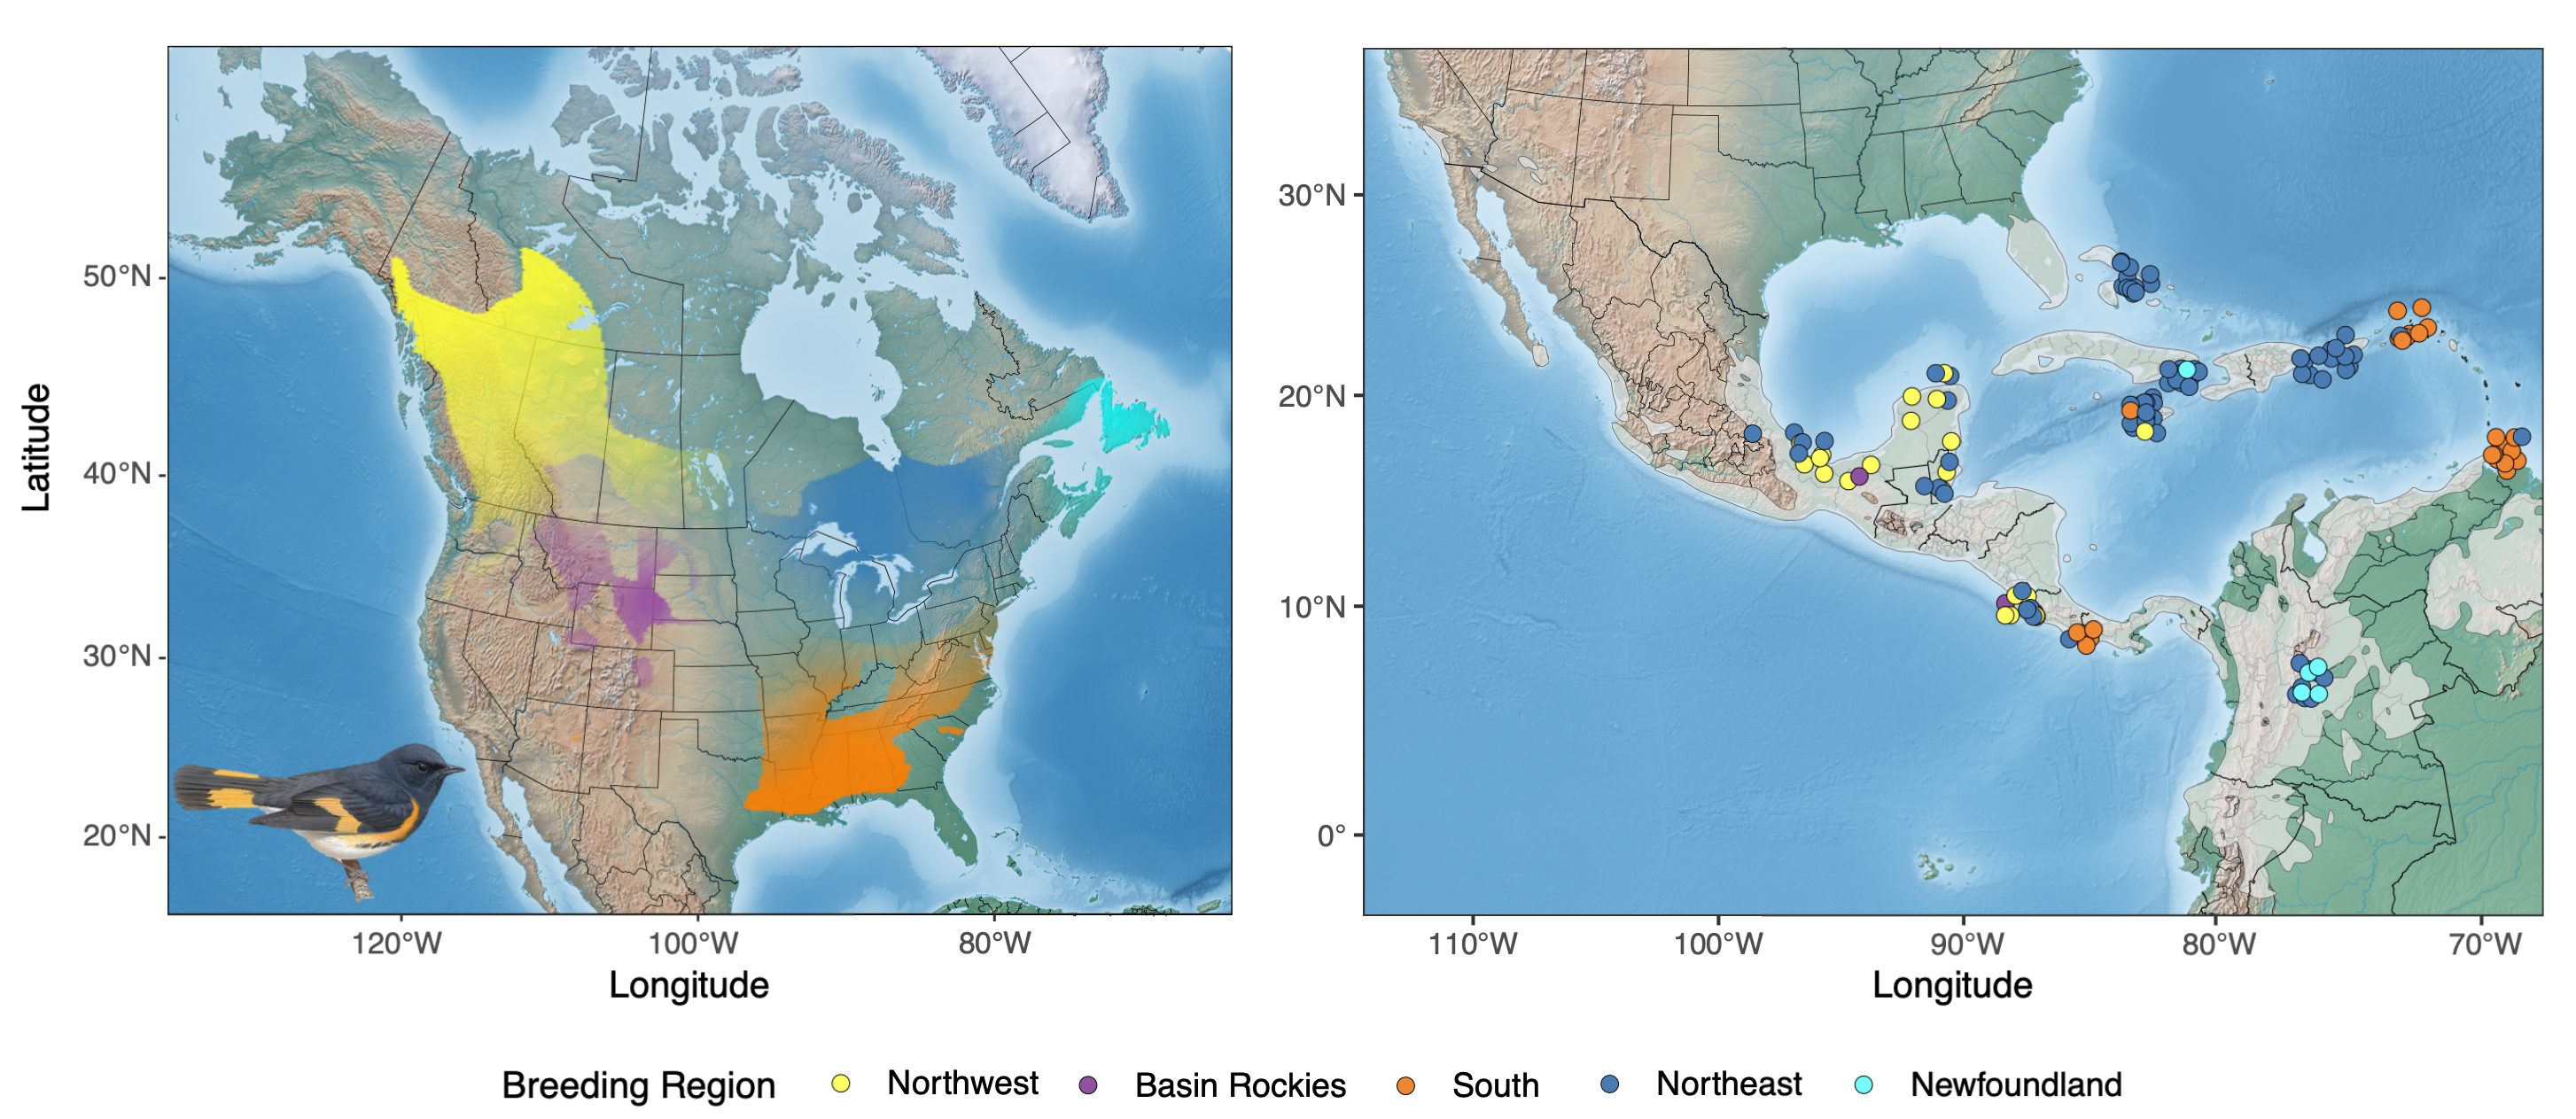
The five genetically distinct populations of American Redstart (Setophaga ruticilla) across the breeding range (left map): Northwest (yellow), Basin Rockies (purple), South (orange), Northeast (blue), and Newfoundland (aqua). Individuals sampled on the wintering grounds (right map) were then assigned back to their respective breeding genetic cluster, allowing us to better understand the migratory connectivity of American Redstart populations. Genetic clusters are visualized as transparency levels of different colors overlaid upon a base map from Natural Earth (naturalearthdata.com) and clipped to the species breeding range using an eBird shapefile. American Redstart Image by © Birds of the World
Team: We have worked in collaboration with Pete Marra of the Smithsonian Institute, Mike Webster of Cornell University, Thomas Sherry of Tulane University, Nick Bayly of SELVA, Keith Hobson of Environment and Climate Change Canada, and Lisle Gibbs of Ohio State University to build a genoscape for the American Redstart (Setophaga ruticilla).
Bird Migration Explorer: Click here to see how Audubon’s Bird Migration Explorer has incorporated our American Redstart genoscape into their base map.
Publications:
DeSaix MG, Anderson EC, Bossu CM, Rayne CE, Schweizer TM, Bayly NJ, Narang DS, Hagelin JC, Gibbs HL, Saracco JF, Sherry TW, Webster MS, Smith TB, Marra PP, KC Ruegg. 2023. Low-coverage whole genome sequencing for highly accurate population assignment: Mapping migratory connectivity in the American Redstart (Setophaga ruticilla). Molecular Ecology:32:5528–5540
Utilized American Redstart Samples
Explore the map below to see when, where, and who collected the samples to build this genoscape.
