Yellow Warbler

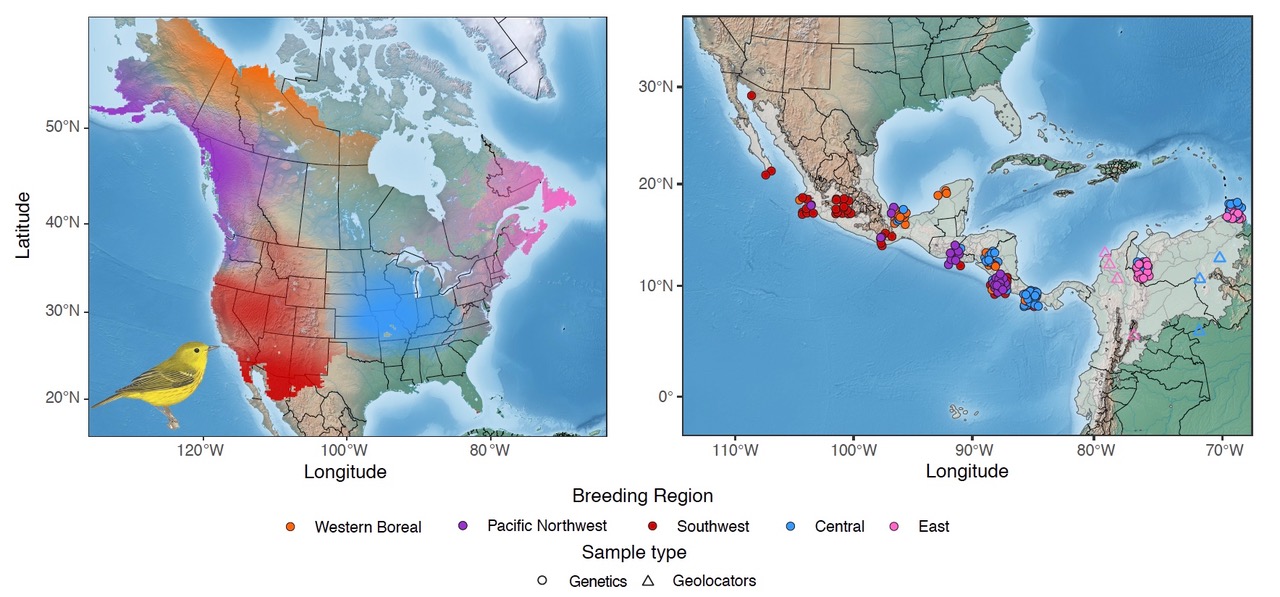
The five genetically distinct populations of Yellow Warbler (Setophaga petechia) (left map) across the breeding range: Western Boreal (orange), Pacific Northwest (purple), Southwest (red), Central (blue), and East (pink). Individuals sampled on the wintering grounds (right map) were then assigned back to their respective breeding genetic cluster, allowing us to better understand the migratory connectivity of Yellow Warbler populations. Genetic clusters are visualized as transparency levels of different colors overlaid upon a base map from Natural Earth (naturalearthdata.com) and clipped to the species breeding range using an eBird shapefile. See below for details of samples used. Yellow Warbler Image by © Birds of the World.
The Yellow Warbler (Septophaga petechia) breeds throughout the United States and Canada, and are considered generally common throughout this range. In some regions, however, populations are declining. One such example is the California Yellow Warbler, which are listed as a species of concern. The cause for these declines are often unknown, but are likely a combination of local stressors, including loss of habitat, and global stressors, such as climate change. We used genomic data to examine the extent to which Yellow Warbler declines can be attributed to shifts in their environment due to ongoing climate change. In addition, we used the Yellow Warbler genoscape to find out where the most vulnerable populations spend the wintering season. Understanding both climate change vulnerability and migratory connections helps us to develop strategies for best managing this species in the future.
The Bird Genoscape partnered with multiple collaborators (see below) to develop high-resolution molecular markers to look at fine-scale population genomic structure of the Yellow Warbler across North America. We scanned the genomes of 195 individuals from 50 sampling locations across their breeding range and identified the existence of 5 genetically distinct populations. These populations can serve as the foundation for Yellow Warbler conservation and management.
Bird Migration Explorer: Click here to see how Audubon’s Bird Migration Explorer has incorporated our Yellow Warbler genoscape into their base map.
Publications:
Bay RA, Karp DS, Saracco JF, Anderegg WRL, Frishkoff L, Wiedenfeld D, Smith TB, and KC Ruegg. 2021. Genetic variation reveals individual-level climate tracking across the full annual cycle of a migratory bird. Ecology Letters 24: 819-828
Bay RA, Harrigan RJ, Underwood VL, Gibbs HL, Smith TB, and K Ruegg. 2018. Genomic signals of selection predict climate-driven population declines in a migratory bird. Science 359: 83-86
Access to Sequencing Data:
https://www.ncbi.nlm.nih.gov/bioproject/PRJNA421926/
https://github.com/rachaelbay/Yellow-Warbler-Climate-Tracking
Team:
Rachel A. Bay, UC Davis
Eric C. Anderson, Southwest Fisheries Science Center
James F. Saracco, The Institute of Bird Populations
Ryan Harrigan, UCLA
Mary Whitfield, Southern Sierra Research Station
Eben H. Paxton, US Geological Survey Pacific Island Ecosystems Research Center
T. Kita
B. Kus
R. Taylor
M. Fylling
L. Gibbs
MAPs station operators within the Institute of Bird Populations Network
Utilized Yellow Warbler Samples
Explore the map below to see when, where, and who collected the samples to build this genoscape.
